amatron
New member
This tutorial shows how to develop and debug a basic ESP8266 project using the ESP8266 OpenOCD portprovided by Sysprogs and Visual Studio. Our latest ESP8266 toolchain includes the OpenOCD build, so you don’t need to install it separately.
Before you begin, install VisualGDB 5.0 or later and follow the instructions described in this tutorial to connect your JTAG debugger to the ESP8266 chip. If you don’t want to use the JTAG interface, you can also debug your programs using the ESP8266 GDB stub as described in this tutorial.
Warning: if you are switching from xt-ocd to OpenOCD, please reconnect the reset signal (RSTB) from SRST (pin 15 on JTAG20) to TRST (pin 3 on JTAG20).
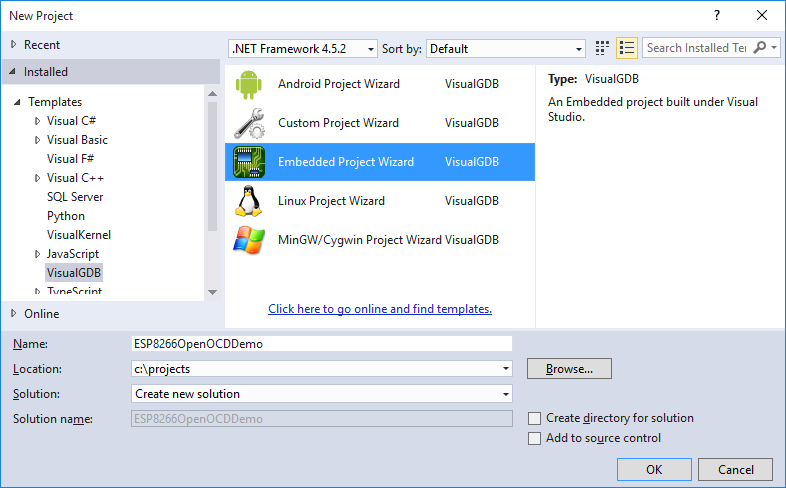
- Start Visual Studio and launch the VisualGDB Embedded Project Wizard:
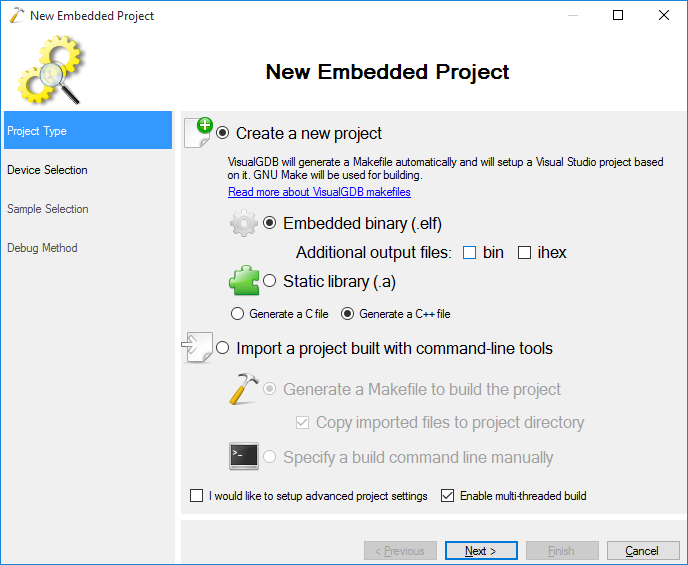
- Select “Create a new project => Embedded binary” and uncheck the “bin” flag:
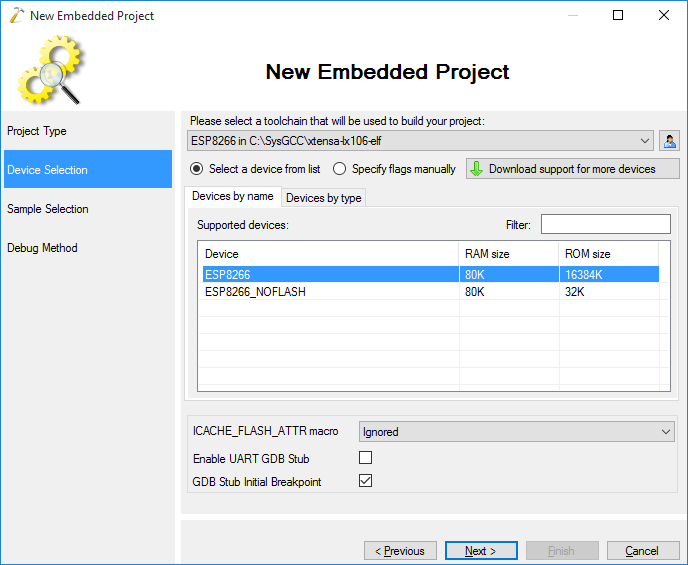
- Select the ESP8266 toolchain and choose the normal ESP8266 device from the list:
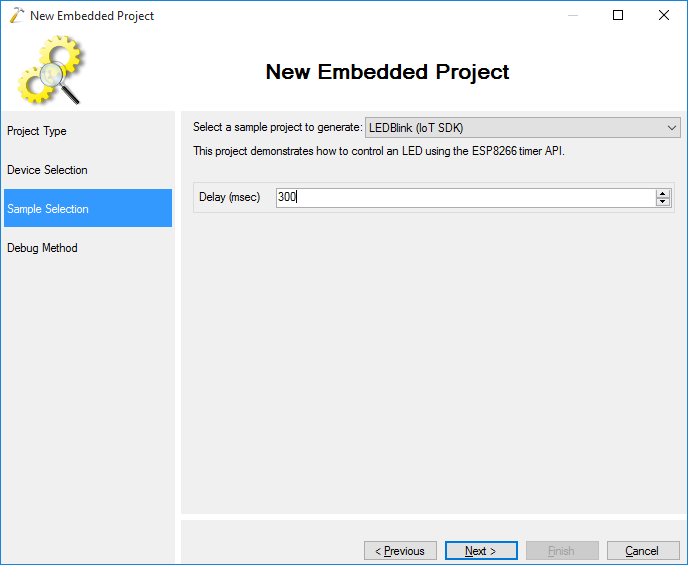
- On the next page proceed with the default LEDBlink sample:
- On the last page of the wizard select OpenOCD as the debug method, connect your JTAG programmer and click “Detect” to automatically select a compatible OpenOCD script. If this does not work, you can select a JTAG programmer model manually or specify a script file explicitly:
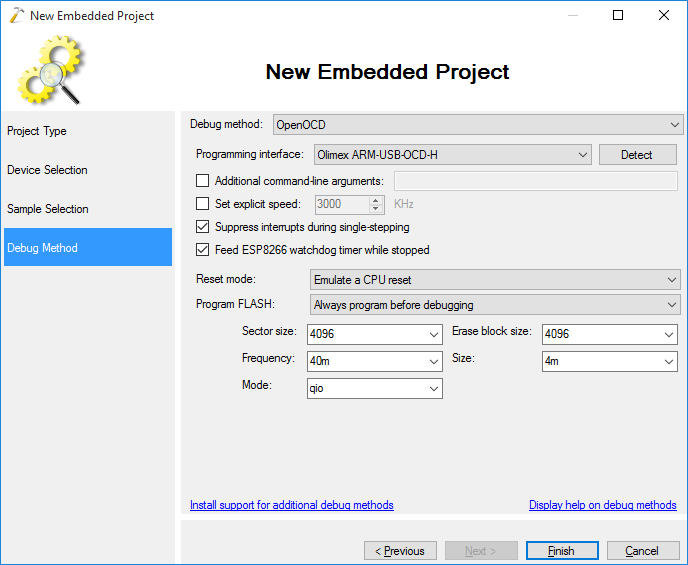 If OpenOCD does not appear in the list, you are using an old ESP8266 toolchain. You can update your toolchain via Tools->Embedded Tools Manager.
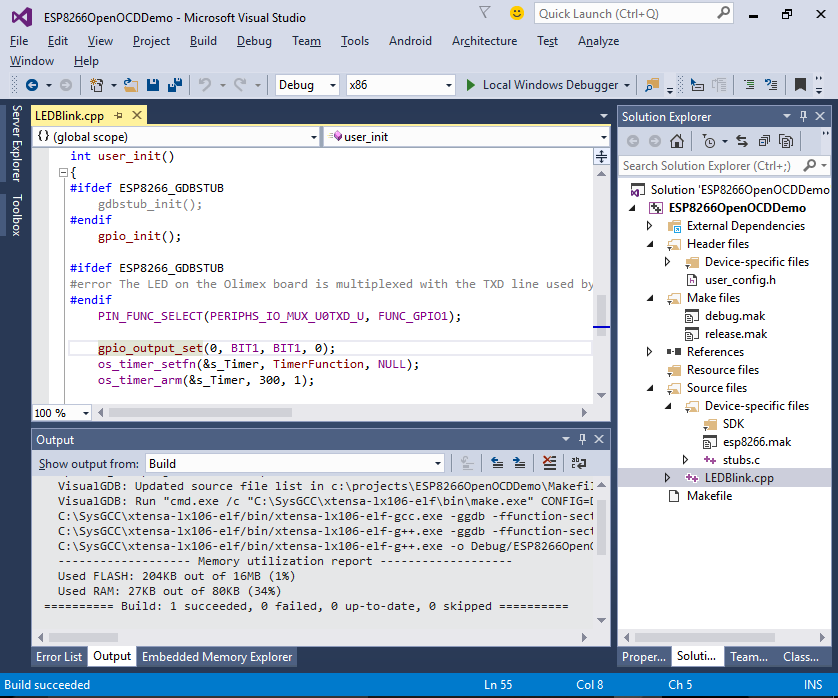
 - Press “Finish” to generate the project. Build it with Ctrl-Shift-B:
- Set a breakpoint in user_init() and hit F5 to start debugging. VisualGDB will program the SPI FLASH automatically and launch your program. If this does not happen, double-check the JTAG connection and ensure that the reset signal is connected to pin 3 of the JTAG20 connector. If OpenOCD fails to connect to your JTAG programmer, follow our tutorial on OpenOCD for ARM to diagnose and repair driver problems automatically:
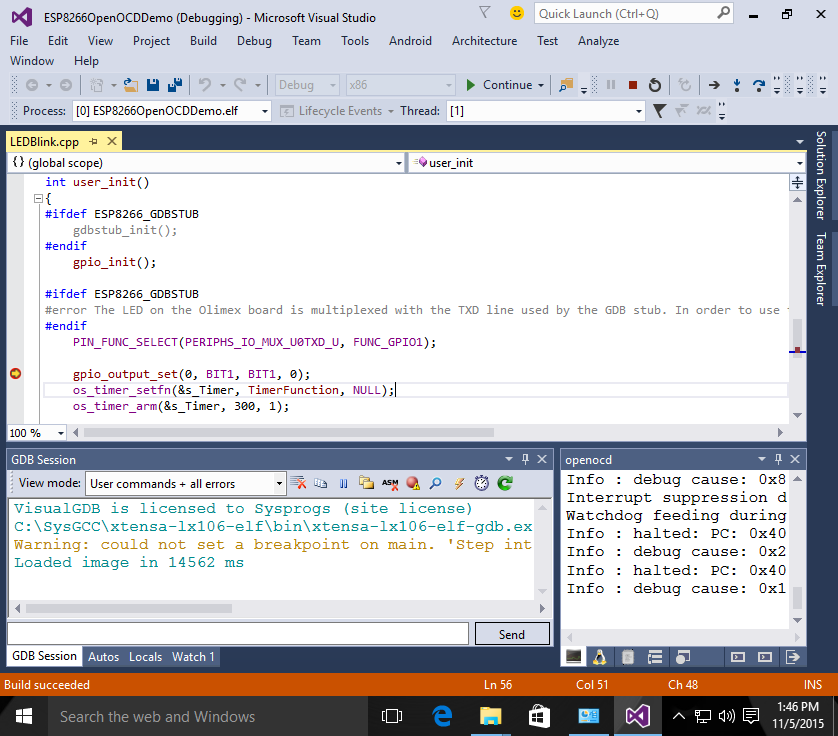 If the debugging starts, but the breakpoint is never hit, try resetting the device by pressing the green “reset” button in the GDB Session window.
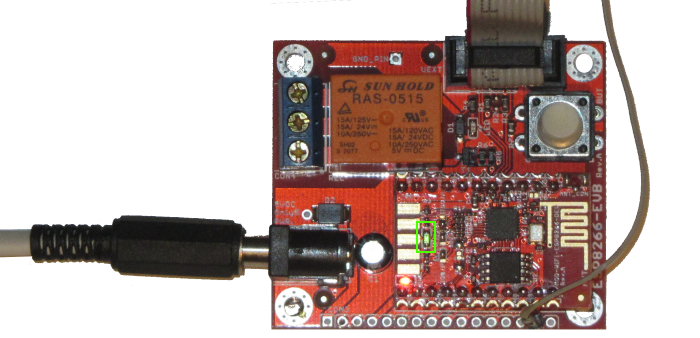
 - Press F5 and observe how the LED on the ESP8266 board is blinking:
- Set a breakpoint in TimerFunction() and wait until the breakpoint is triggered:
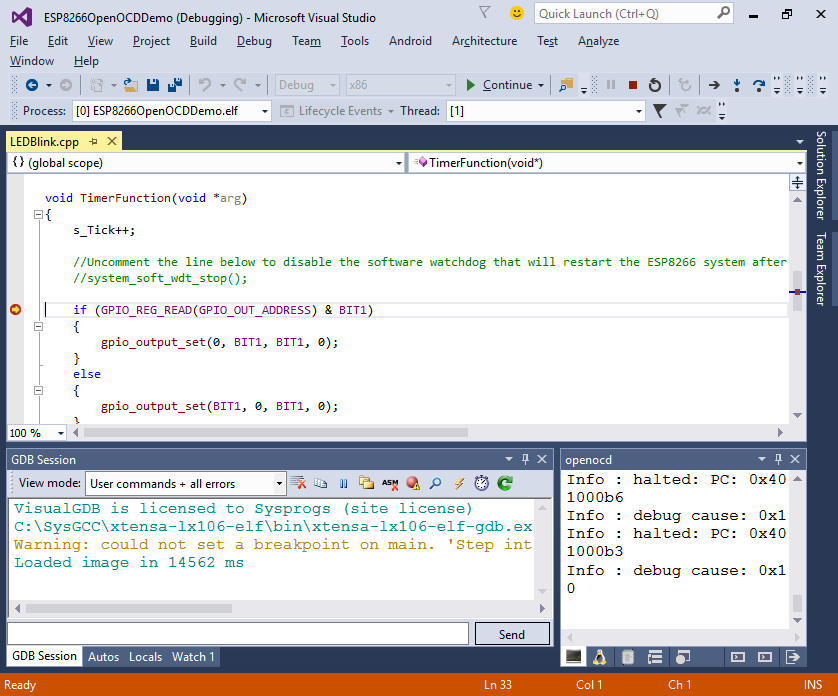
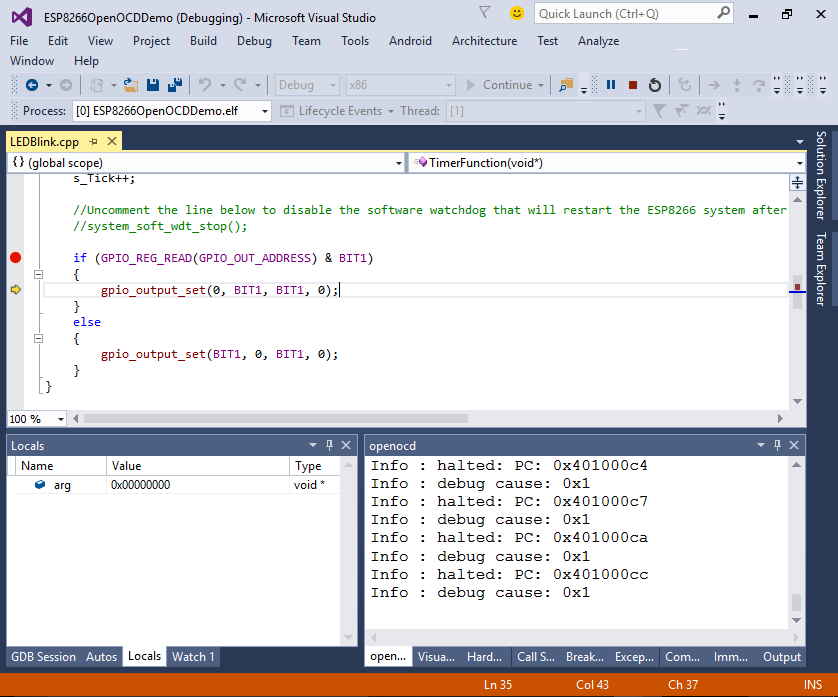
- Try stepping over the function calls by pressing F10. If you are using OpenOCD, it will automatically feed the ESP8266 watchdog preventing it from restarting your system. Otherwise, you would need to uncomment the call to system_soft_wdt_stop():
- You can change various debug-related settings by right-clicking on your project in Solution Explorer, selecting VisualGDB Project Properties and going to the Debug Settings page:
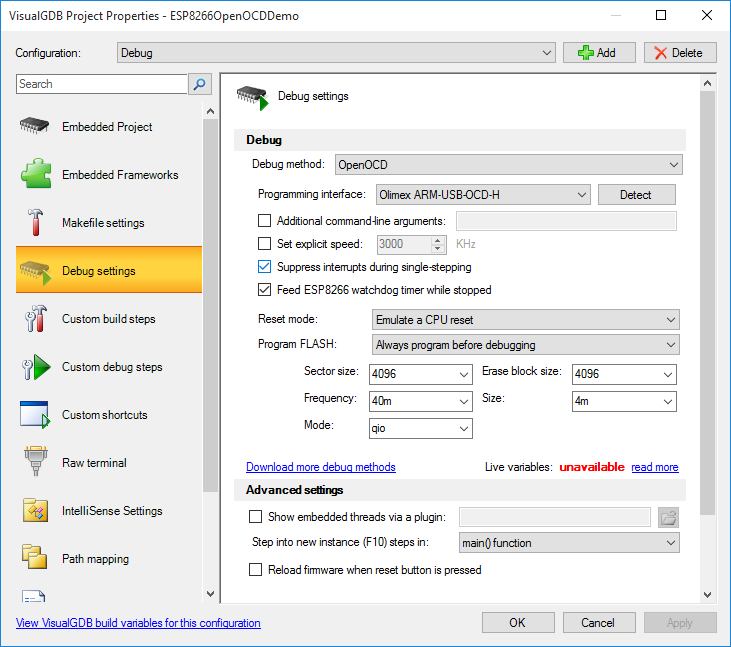 E.g. you can reduce the JTAG speed to improve stability or disable interrupt suppression or watchdog feeding features if they are interfering with your code.